The Most Common Rice Purity Score
A breakdown of the average and median rice purity test score using the anonymous results recorded on this site, plus why reported averages vary.
People searching for the average rice purity score usually want one clean number, but the honest answer needs two numbers and some context. On this site, the anonymous results recorded across 83 completed tests put the average at 64.9 and the median at 70. Those are not the same thing, and the gap between them tells you something real about how scores are actually spread out.
Average versus median, and why it matters here
The average is the sum of all scores divided by the number of tests. The median is the middle value when every score is lined up in order. When a data set is evenly spread, average and median sit close together. When a few extreme values pull in one direction, they separate. That is exactly what happens with Rice Purity Test scores.
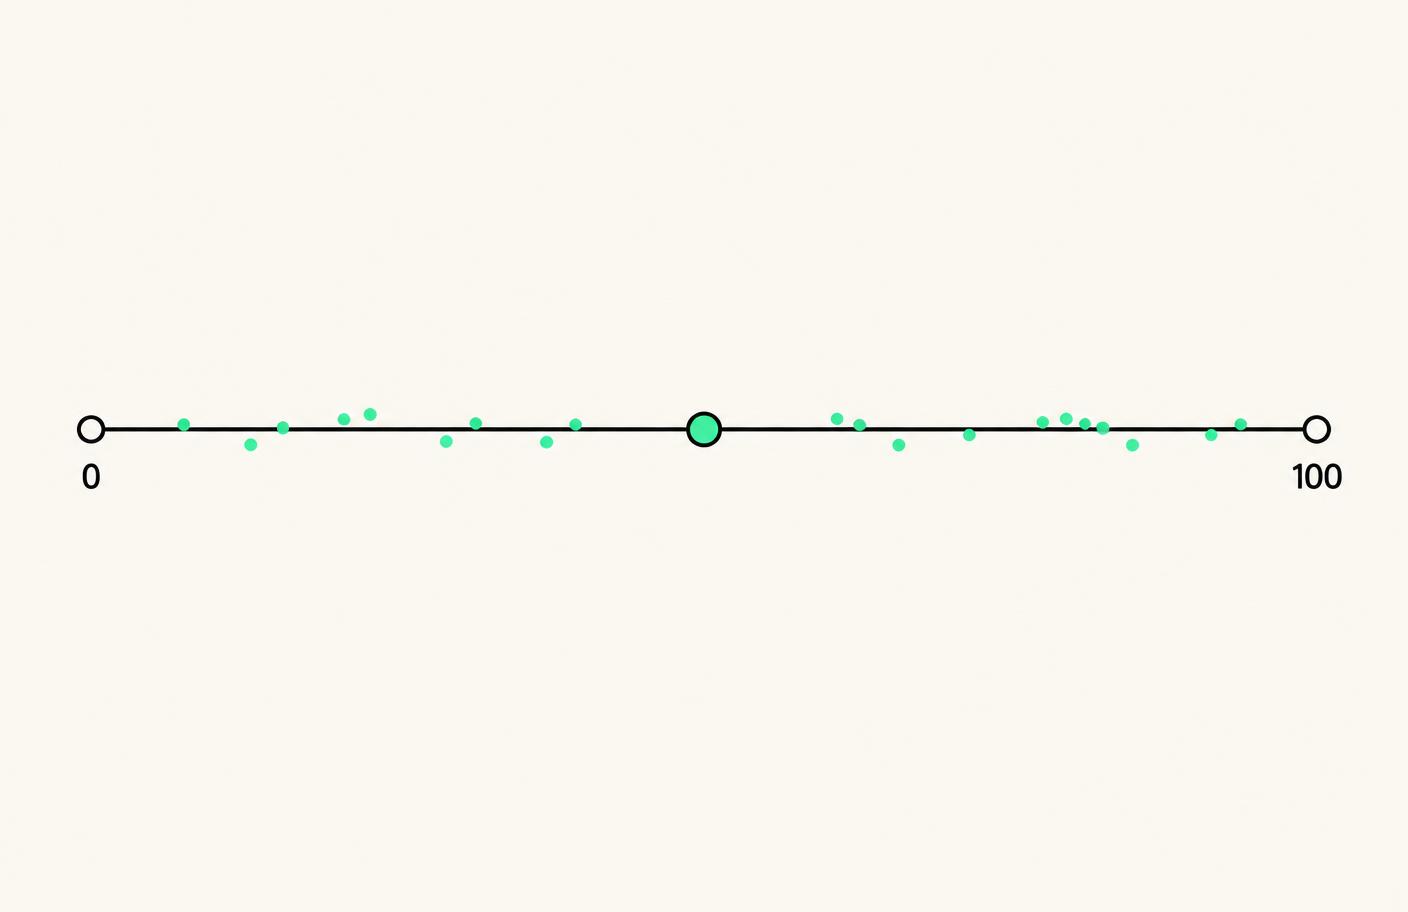
Out of 83 completed tests, 17 fall below 40. Those very low scores drag the average down to 64.9, even though the median of 70 shows that a typical person's score is closer to that mark. If you want the mechanics of how each point is calculated, see how the score is calculated.

Average and median scores diverge when low outliers pull the mean down.
Why claimed averages online differ so much
Search around and you will find different sites quoting different "average" scores, often somewhere between 60 and 80. That variation is expected, not suspicious, for a few reasons.
Every site draws from its own visitor pool, and pools differ by age, country, and how people found the test.
Sample sizes vary widely. A site with a few dozen results will report a shakier average than one with thousands.
Some published averages are not measured at all, just repeated from older posts without a real data source. This article only uses the anonymous results recorded on this site rather than numbers borrowed from elsewhere.
Our recorded numbers, band by band
Here is the full breakdown of the 83 completed tests by score band.
Notice that no single band dominates. Scores are spread fairly evenly, with a slight lean toward the top band (90 to 100) and the bottom band (below 40). That U shaped tendency, more people at the extremes than in the dead center, is common in small samples of self-reported checklists.
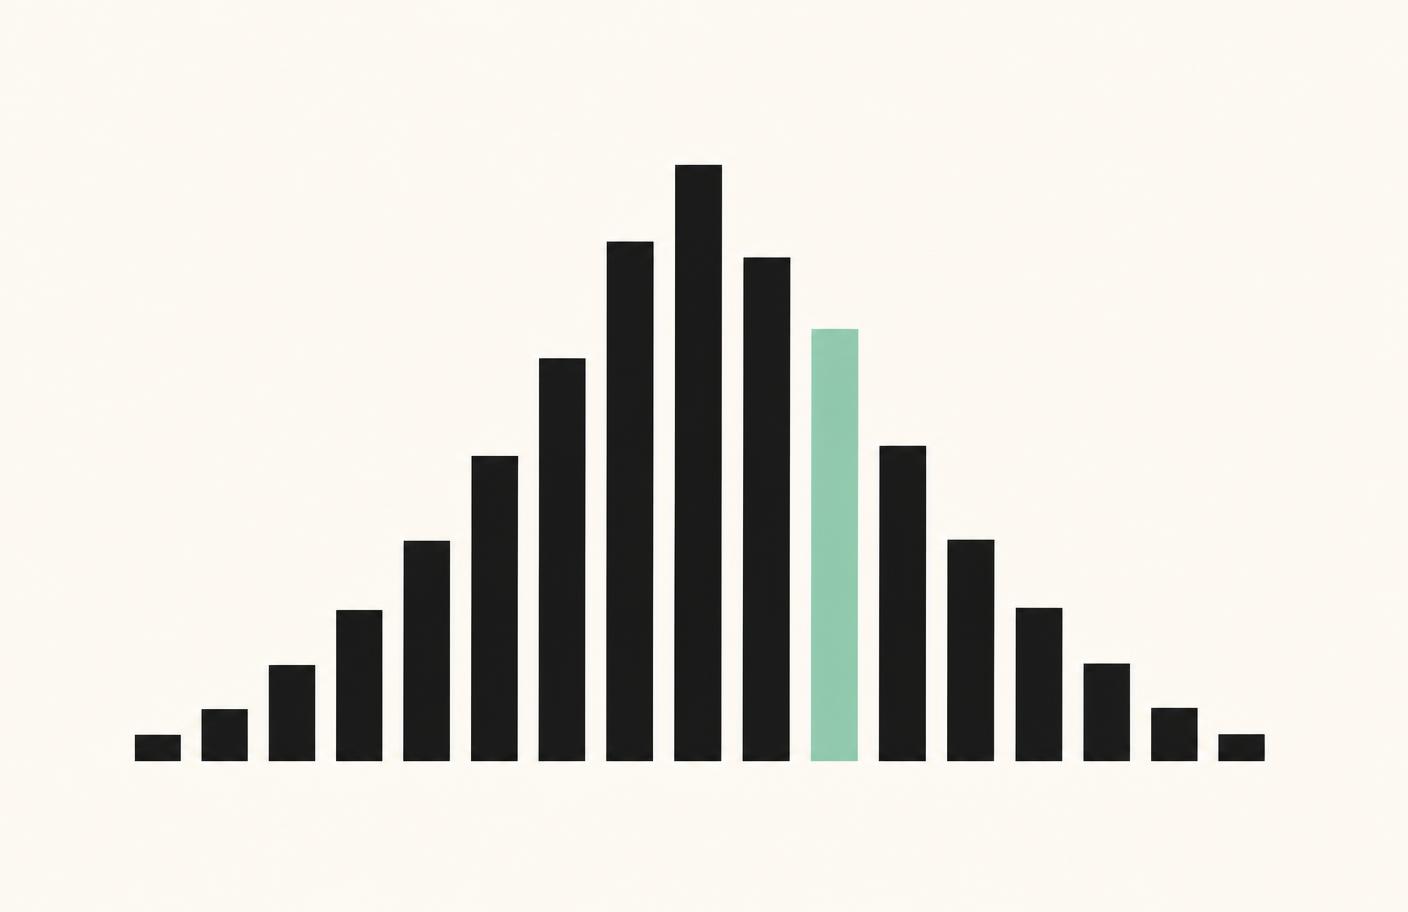
Recorded scores lean toward both the highest and lowest bands rather than clustering in the middle.
Why age and campus context shift results
The checklist was born as student culture at Rice University in Houston, and it still reflects a lot of college era experiences. That matters for how scores shift across groups.
Younger test takers, including incoming students, tend to score higher simply because fewer items have had time to apply.
People further along in college or post-college life tend to score lower, since more checklist items become relevant with more years and independence.
Campus culture and social circle affect which items apply. A commuter student and a student living in dorms may check very different items even at the same age.
None of this means one score is more "correct" than another. It just explains why a single average can never represent everyone taking the test.
Scores often come up as a casual comparison point among friends or classmates.
What a typical score looks like
If you want a single takeaway: a typical score on this site sits around 70, the median value, while the average of 64.9 gets pulled lower by a meaningful chunk of very low scores. Neither number is "right" on its own. Together they describe a distribution where most people land in the middle to upper range, with a noticeable tail of much lower scores. Take the Rice Purity Test yourself and see where your result fits into these bands.
Frequently asked questions
What is the average rice purity score on this site?
Based on the anonymous results recorded on this site, the average across 83 completed tests is 64.9.
Is the median more useful than the average?
For this data set, yes. The median of 70 better represents a typical test taker, since the average is pulled down by a group of very low scores.
Why do other sites report different averages?
Different visitor pools, different sample sizes, and in some cases numbers repeated without a real measured source all lead to different reported averages.
Does age affect the average score?
Yes. Younger test takers tend to score higher, and scores tend to drop as people accumulate more life experience over time.
Where can I read more about specific score meanings?
See what your rice purity score really means for a full band by band explanation.